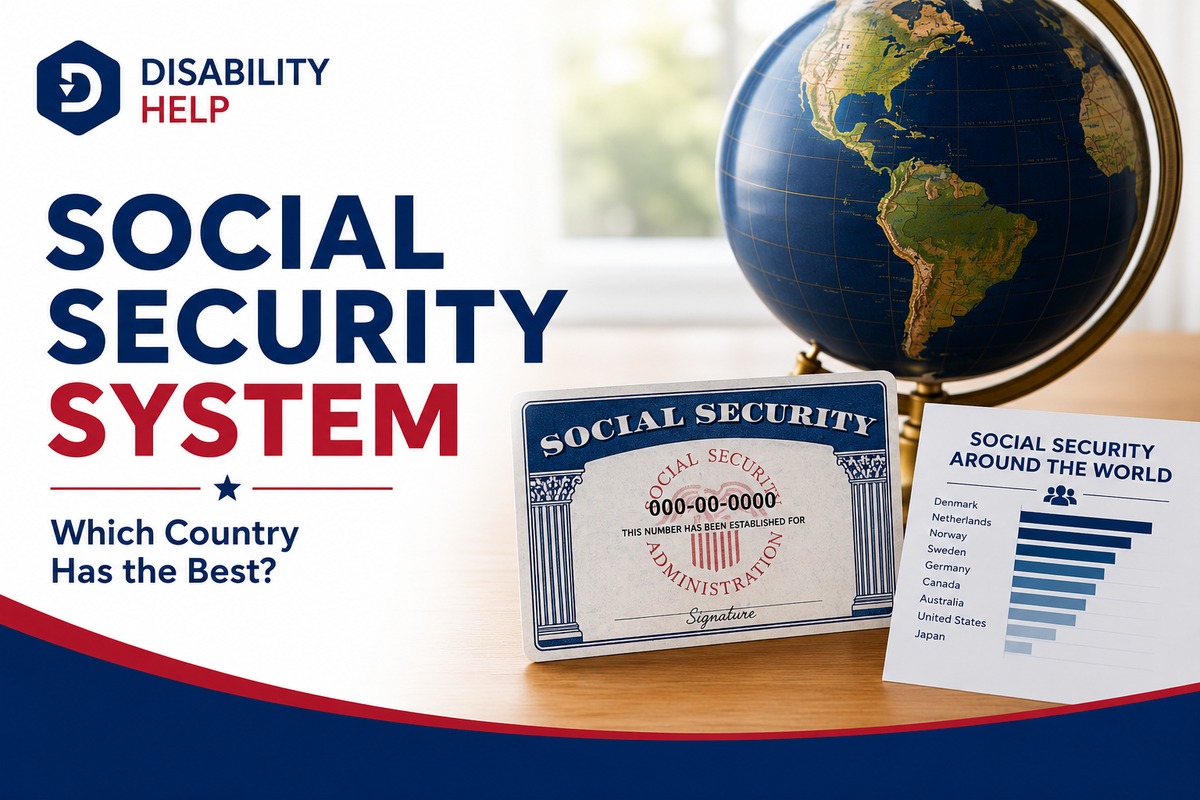
The Netherlands has the best social security system in the world. The 2025 Mercer CFA Institute Global Pension Index ranked the Dutch retirement income system first out of 52 countries with a score of 85.4 out of 100, followed by Iceland (84.0), Denmark (82.3), Israel, and Singapore, the only five countries holding the elite “A” grade globally (CFA Institute, 2025). The United States placed 30th with a C+ grade and a score of 61.1, well behind the leaders.
This guide breaks down what sets the top countries apart, how the U.S. compares, and why those differences matter if you rely on Social Security or are weighing a disability benefits application.
Key Takeaways
- Netherlands ranks #1: The Dutch system scored 85.4 out of 100 in the 2025 Mercer CFA Institute Global Pension Index, the highest of 52 countries assessed.
- Five “A-grade” systems: the Netherlands, Iceland, Denmark, Israel, and Singapore are the only countries with scores above 80 in the 2025 ranking.
- United States ranks 30th: The U.S. earned a C+ grade and a 61.1 score in 2025, behind Canada, the U.K., Australia, and most of Western Europe.
- Replacement rates expose the gap: Dutch retirees receive 96% of pre-retirement income compared to 50.4% in the U.S., per OECD 2025 data.
- Coverage is the U.S. weakness: Mercer flagged voluntary 401(k) participation as the structural issue keeping the U.S. out of the top tier.
- Three pillars define the best systems: Every A-grade social security system combines a public safety net, mandatory occupational pensions, and voluntary savings.
How the World's Social Security Systems Are Ranked
The Mercer CFA Institute Global Pension Index is the most widely cited authority on how countries compare on retirement and social security. Now in its 17th year, the 2025 edition benchmarks 52 retirement income systems that cover 65% of the world's population, scoring each one across three weighted pillars.
The three pillars and their weights are adequacy (40%), which measures benefit levels and how well systems prevent poverty in old age; sustainability (35%), which evaluates whether the system can survive demographic and fiscal pressure; and integrity (25%), which assesses governance, regulation, and transparency. Each country receives a score from 0 to 100. Systems above 80 earn an “A” grade. The 2025 grade ranges run from India at 43.8 (the lowest score) to the Netherlands at 85.4 (the highest).
The OECD's Pensions at a Glance 2025 report adds a second metric used throughout this guide: the net pension replacement rate, which measures the share of working income retirees keep once benefits, taxes, and contributions are factored in. Replacement rate data offers a clearer picture of how much income retirees actually have month to month, regardless of how a system is structured on paper.
Top 10 Countries with the Best Social Security Systems in 2026
The 2025 Mercer rankings produced a clear top tier and a familiar middle. Five countries hold A-grades. The next several are tightly clustered in the B+ band, separated by less than five points. The table below shows the top 10 systems based on the 2025 Mercer CFA Institute Global Pension Index, including each country's published score and grade.
| Rank | Country | Grade | Score | Distinct Strength |
|---|---|---|---|---|
| 1 | Netherlands | A | 85.4 | Universal mandatory occupational pensions |
| 2 | Iceland | A | 84.0 | Highest sustainability score globally |
| 3 | Denmark | A | 82.3 | Strong tax-funded public foundation |
| 4 | Israel | A | 80+ | Comprehensive social protection coverage |
| 5 | Singapore | A | 80+ | First Asian country to earn an A grade |
| 6 | Australia | B+ | High 70s | Mandatory superannuation contributions |
| 7 | Finland | B+ | 76.6 | Highest integrity score globally (90.6) |
| 8 | Norway | B+ | High 70s | Balanced public-private mix |
| 9 | Sweden | B+ | High 70s | Notional defined contribution model |
| 10 | Chile | B+ | High 70s | Reformed individual account system |
Singapore's 2025 promotion to A-grade is the headline change in the latest index. The country went from a C-grade in 2009 to an A-grade in 2025, the largest sustained climb in the index's 17-year history per Mercer's lead author Tim Jenkins (Mercer, 2025). The U.S. did not break into the top 25 again in 2025, holding 30th place with only marginal score growth from 2024.
Why the Netherlands Has the Best Social Security System
The Netherlands earns the top spot through a coordinated three-pillar pension system that combines universal coverage, mandatory occupational savings, and voluntary supplementary plans, with a public safety net that prevents poverty in old age regardless of work history.
The first pillar is the AOW (Algemene Ouderdomswet), a flat-rate state pension that pays every legal resident at retirement age. Workers accrue 2% of a full AOW pension for each year they live or work in the Netherlands, with full benefits at 50 years of residence. The pension is funded through general taxation rather than payroll contributions, which makes it broadly progressive.
The second pillar is the occupational pension system. Roughly 90% of Dutch employees are enrolled in industry-wide or company pension funds, and those funds typically replace 70% to 80% of average career earnings on top of the state pension. Coverage is near-universal because participation is mandatory in most industries, set through collective labor agreements rather than left to individual choice.
The third pillar is voluntary supplementary savings, similar in concept to a U.S. IRA but with stronger tax incentives and better integration with the second pillar. Together, the three pillars stack to deliver an income replacement level no other developed country matches.
The OECD's 2025 Pensions at a Glance report shows that an average-earning Dutch worker who retires today receives a net pension replacement rate of 96%, the highest among the 38 OECD member countries (OECD, 2025). In plain terms: a Dutch worker earning the equivalent of $60,000 keeps roughly $57,600 in equivalent purchasing power after retiring. That is the practical definition of a social security system that works.
How the United States Social Security System Compares
The U.S. ranked 30th out of 52 countries in the 2025 Mercer index, with an overall C+ grade and a score of 61.1, up slightly from 60.4 in 2024. On the three sub-indices, the U.S. scored 64.1 on adequacy, 59.9 on sustainability, and 58.0 on integrity, per Mercer's 2025 published results.
The U.S. score keeps it well behind Canada and New Zealand (both 70.4, B grade) and the United Kingdom (72.2, B grade). It places the U.S. in the same band as France, Hong Kong, Spain, and Saudi Arabia.
Where the U.S. genuinely lags is in the replacement rate. The OECD calculates that an average-earning American worker receives a net average pension replacement rate of 50.4% from Social Security alone, compared to the OECD average of 63.2% and the Dutch 96%. That 13-point gap below the OECD average is what forces most American workers to depend on private 401(k) and IRA savings to maintain anything close to their working income in retirement.
Christine Mahoney, Mercer's Global Defined Benefit and Defined Contribution Leader, told CNBC in 2025 that the single biggest factor holding the U.S. back is voluntary participation. “For the U.S. system, the thing that could change that grade significantly, the most important is actually coverage,” Mahoney said. “Our 401(k) plans are voluntary” (CNBC, 2025).
This matters most for workers who depend on Social Security Disability InsuranceA form of insurance that provides income to individuals who are unable to work due to a disability. or Supplemental Security Income. Roughly 8.1 million adults received SSDI benefits in 2025, and the average monthly SSDI payment as of February 2026 was about $1,634 per the Social Security Administration (SSA). Compared to the Netherlands' 96% replacement rate, the U.S. structure puts a heavier weight on private savings that disabled workers may not have been able to build before becoming unable to work.
Five Things the World's Best Social Security Systems Have in Common
Looking at the five A-grade countries side by side reveals a shared design pattern. Each one combines the same core ingredients in slightly different proportions. The list below summarizes what every top-ranked system gets right.
- Universal mandatory coverage. Every A-grade country requires participation rather than encouraging it. Mandatory enrollment in occupational pensions or government-managed funds eliminates the coverage gaps that pull the U.S. score down.
- A flat-rate public pension as a poverty floor. The Dutch AOW, the Danish folkepension, and Iceland's tax-funded public pension all guarantee a minimum income regardless of work history, removing the risk that an inadequately covered worker falls into elder poverty.
- Earnings-related occupational pensions on top. A second, work-based layer scales benefits to lifetime contributions, so middle and upper earners can maintain their standard of living after retirement, not just survive on the public floor.
- Independent governance and transparency. Finland leads the integrity sub-index at 90.6, reflecting strict regulation, transparent reporting, and member communication standards. Every A-grade system scores above 80 on integrity.
- Periodic reform tied to demographics. The top countries adjust retirement ages, contribution rates, and benefit formulas as life expectancy and labor force participation change. Mercer notes that pension assets in OECD countries rose 10% in 2024, reaching $63.1 trillion globally.
Key Terms in Global Social Security Rankings
Understanding the rankings requires a few definitions that get used interchangeably in news coverage but mean specific things in the actual reports.
Adequacy. A measure of how well a system prevents poverty and replaces working income. It looks at minimum pension levels, replacement rates for average and lower earners, household savings rates, and home ownership. It carries 40% of the total Mercer score.
Sustainability. A measure of whether the system can absorb demographic and economic pressure over the next several decades. It includes coverage rates, the level of pension assets relative to GDP, life expectancy, public debt, and economic growth.
Integrity. A measure of governance, regulation, and member protection. It evaluates how funds are governed, how members are communicated with, and what protections exist against fraud or mismanagement. Finland leads this sub-index at 90.6.
Net pension replacement rate. Calculated by the OECD, this is the percentage of an average worker's income that retirement income replaces, after taxes and contributions are accounted for. It is the cleanest single measure of whether a system delivers a livable retirement.
Three-pillar system. The World Bank framework that organizes pension provision into a public safety net (Pillar 1), mandatory occupational savings (Pillar 2), and voluntary individual savings (Pillar 3). Every A-grade country has a working version of all three.
What This Means for Americans Applying for Disability Benefits
The U.S. ranking places real pressure on individuals to fill the gap between what Social Security covers and what they need. For workers with disabilities, that pressure is sharper.
If you cannot work because of a long-term physical or mental condition, your two main options through the Social Security Administration are SSDI (Social Security Disability Insurance) and SSI (Supplemental Security Income). SSDI is for workers who have paid enough Social Security taxes to qualify. SSI is for people with limited income and resources, regardless of work history. Some people qualify for both.
The 50.4% U.S. replacement rate is calculated for an average-earning worker who reaches retirement. For someone forced to apply for SSDI mid-career, the practical effect on lifetime income is typically lower, because benefits are calculated on lifetime indexed earnings before the disability began. That makes the application and appeals process consequential. Initial SSDI denials are common, and most successful claims involve at least one appeal. If you have already received a denial letter or are preparing to apply, our step-by-step guide to applying for SSDI online walks through what to gather before reapplying or appealing.
The structural lesson from the global rankings is that the U.S. system was built to be a partial replacement, not a full one. Treating SSDI and SSI applications with the same level of preparation you would bring to a major insurance claim is consistent with how the system actually works.
Frequently Asked Questions
Which country has the best social security system in 2026?
The Netherlands has the best social security system in 2026, based on the most recent Mercer CFA Institute Global Pension Index released in October 2025. The Dutch system scored 85.4 out of 100, ahead of Iceland (84.0), Denmark (82.3), Israel, and Singapore, which together hold the only “A” grades among 52 ranked countries.
Where does the United States rank in social security globally?
The United States ranks 30th out of 52 countries in the 2025 Mercer CFA Institute Global Pension Index, with a C+ grade and a score of 61.1. The U.S. trails Canada, the United Kingdom, Australia, and most of Western and Northern Europe. Mercer attributes the relatively low score to voluntary 401(k) participation, lower coverage rates, and a 50.4% net pension replacement rate per the OECD's 2025 data.
Why is the Netherlands ranked first?
The Netherlands ranks first because of its three-pillar pension structure: a tax-funded universal state pension (AOW), mandatory industry-wide occupational pensions covering roughly 90% of employees, and voluntary supplementary savings. The combination delivers a 96% net pension replacement rate for average earners, the highest among OECD countries per the 2025 Pensions at a Glance report.
What is a good social security replacement rate?
A net pension replacement rate above 70% is generally considered adequate for maintaining pre-retirement living standards. The OECD average is 63.2%. The Netherlands sets the high mark at 96%, while the U.S. delivers 50.4% for an average earner. Disability benefitsFinancial assistance provided to individuals who are unable to work due to a disability, such as Soc... typically replace less than retirement benefits, because disabled workers often have shorter contribution histories before claiming.
Does U.S. Social Security include disability coverage?
Yes. The U.S. Social Security system includes two disability programs: Social Security Disability Insurance (SSDI)A U.S. government program that provides financial assistance to individuals who are unable to work d... for workers who have paid enough payroll taxes, and Supplemental Security Income (SSI) for people with limited income and resources. Roughly 8.1 million adults received SSDI in 2025 per the SSA, and the average SSDI payment in February 2026 was about $1,634 per month.
What the Global Rankings Mean for You
As of 2026, the Netherlands holds the title of best social security system in the world per the Mercer CFA Institute Global Pension Index, with Iceland, Denmark, Israel, and Singapore close behind. The U.S. sits in the middle of the global pack at 30th, weighed down by voluntary participation and a 50.4% replacement rate that forces most workers to lean on private savings.
Next Steps: Understanding Your Disability Benefits Eligibility
If you are applying for U.S. disability benefits or already receiving them, understanding where the system fits globally helps explain why preparation, documentation, and appeal know-how matter so much. Start with our SSDI vs SSI eligibility guide to figure out which program fits your situation, then build from there.